
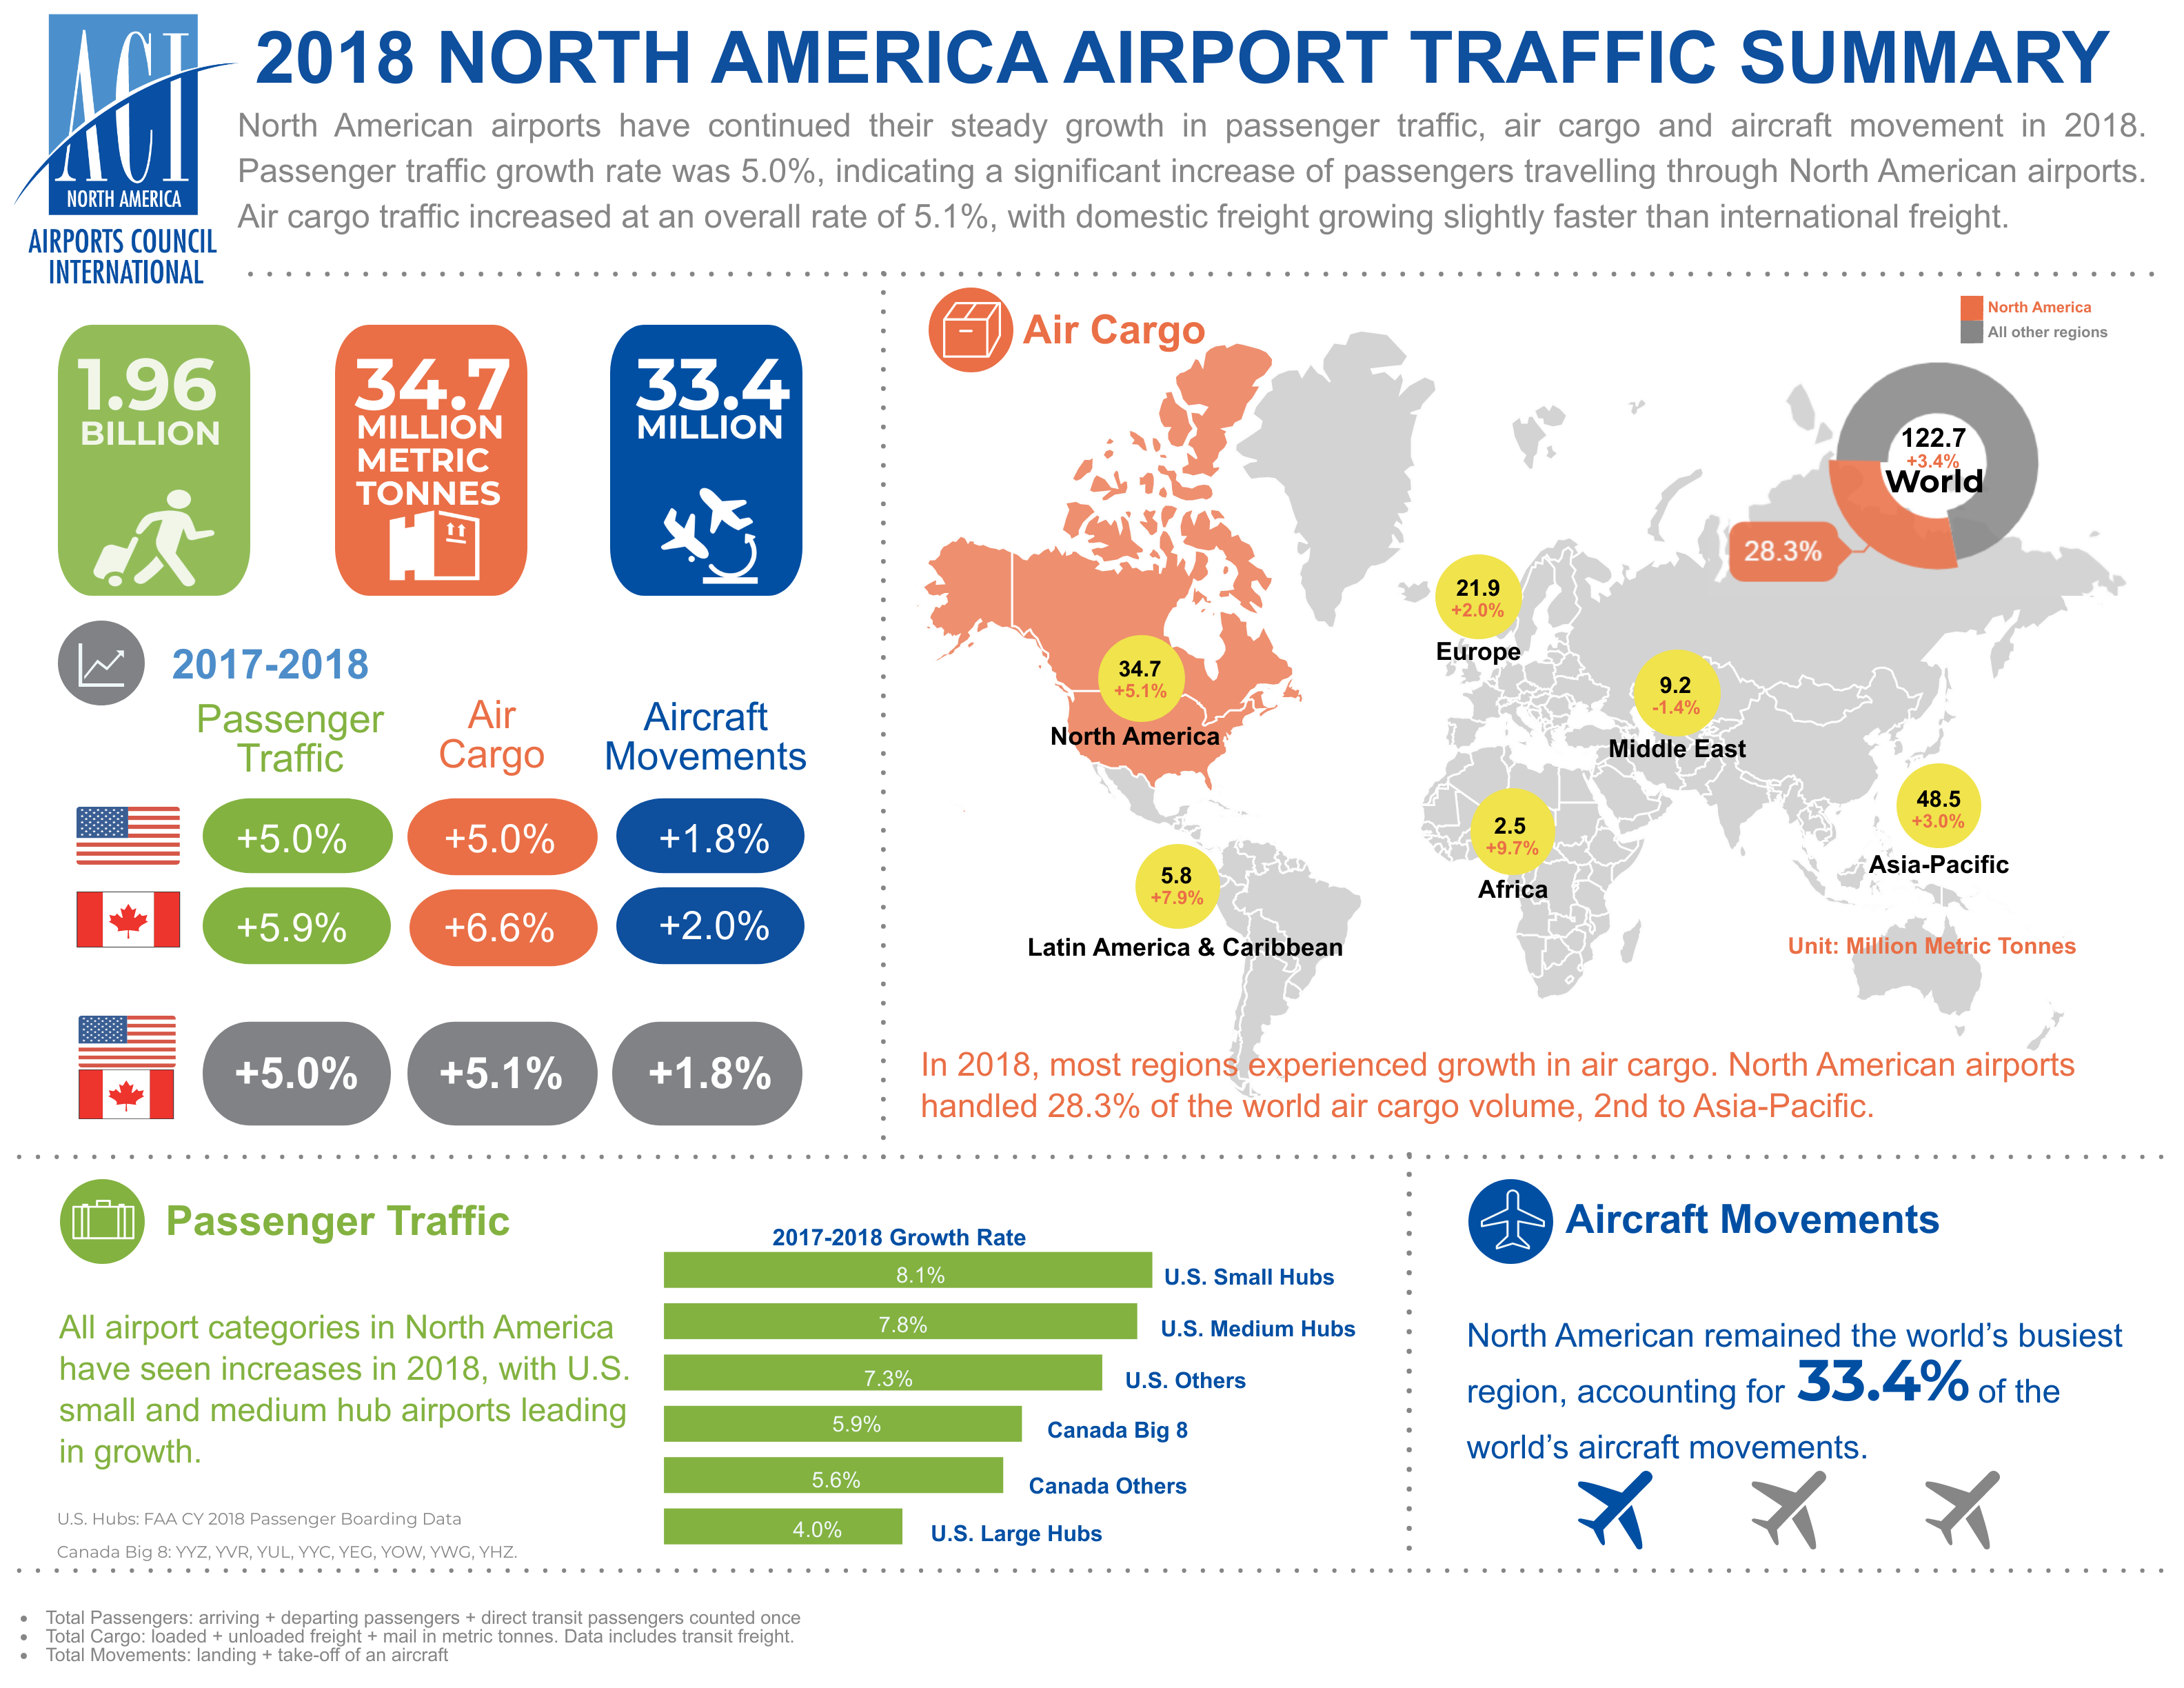
TAMPA, FL – Airports Council International-North America (ACI-NA) today released the 2018 North American Airport Traffic Summary, containing passenger, cargo and aircraft operations data from 254 North American airports. 2018 was a record-breaking year for air travel and shipping as passenger traffic and cargo volume grew more than five percent.
“Airports across North America continue to experience record-setting growth, further demonstrating the dire need for airport infrastructure improvements,” said ACI-NA President and CEO Kevin M. Burke. “Modern and efficient airport infrastructure is the key to improving passenger experiences, but airports are being forced to do more with less because our primary infrastructure funding mechanism has not been updated in nearly two decades.
“Over the next few years, American airports face over $128 billion in critical infrastructure needs. This reflects a more than 28 percent increase since 2017, and an 80 percent increase since 2013,” Burke said. “We continue to urge lawmakers to provide airports with the tools necessary to make local infrastructure investment decisions, which will allow us to better serve passengers and strengthen local communities.”
Key Findings
- North American airports experienced a 6.4 percent increase in international passenger traffic and a 4.8 percent increase in domestic passenger traffic.
- Atlanta Hartsfield-Jackson International Airport remained the world’s busiest airport with more than 107 million passengers.
- Toronto Pearson International Airport is once again Canada’s most traveled airport with 49.5 million passengers, an increase of 5.0 percent from 2017.
- Memphis International Airport continues to be the busiest cargo airport in North America, handling nearly 4.5 million metric tons.
- Globally, one out of every three aircraft took off or landed at a North America airport in 2018.
- More than five times the combined U.S. and Canadian population arrived at or departed from North American airports in 2018.
The 2018 North American Airport Traffic Summary contains passenger, freight/mail and aircraft operations data for 254 North American airports. Total passengers represent the sum of passengers enplaned and deplaned on all commercial aircraft, but not those who travel on business or general airplanes. Total cargo figures represent the sum of the total freight and mail—both loaded and unloaded—at the reporting airport. Total aircraft movements reflect the sum total of all domestic commercial, international commercial, commuter, general aviation, and military take-offs and landings. A summary of the data for the top 50 North American airports is available on ACI-NA’s website.
###